This glossary is mostly in alphabetical order, with an expected goals section at the bottom here.
Age curve
The curve in performance-level during a player’s career, rising when they’re young and dipping as they get older.
Studies have been done (here, in 2013, for example) on what the general age curve looks like in football, but these differ by position, statistic looked at, and, of course, the individual. Generally, ‘peak performance’ or peak age is considered to be around 24-28.
Big chance
Note: this stat only comes from the data company Opta. It is a shot which has been designated by one of the people tagging the game as a big chance of scoring.
Further note: many data companies gather their data by employing analysts to watch the game and ‘tag’ events as they happen. You can watch a brief (though slightly old) video on the process here.
Contribution (‘Shot/goal/expected goal contribution’)
The number of shots that a player takes or sets up is their ‘shot contribution’. Can equally apply to goals (with goals and assists) or expected goals (with expected goals and expected goals assisted).
Conversion rate
The percentage of a player or team’s shots that are scored.
Event data
The term usually used to describe on-the-ball data.
Game state
Whether one team is leading, drawing, or trailing a match.
Studies have shown (with one of the first all the way back in 2012) that winning or trailing affects the way that teams play, crucially the amount of shots and where they’re taken from.
Game state can therefore be an important thing to consider when looking at statistics from a match, or a team’s stats over multiple games.
For example: “Burnley have a lot of points but their stats aren’t very impressive. Maybe game state is a factor and they keep going ahead early in matches and spent most of their time sitting back to defend their lead.”
A close game state is one where a team is level or trailing/leading by a single goal.
Half-space
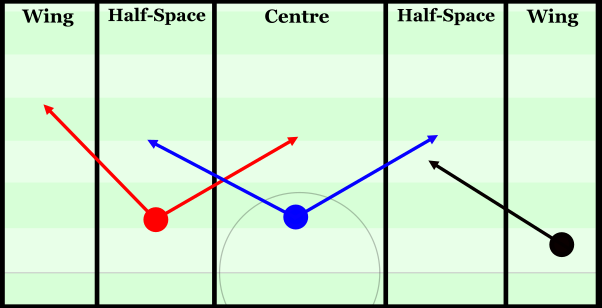
The half-space is a term often used in tactical writing, but it’s a useful term to have for that in-between space that’s not quite wing and not quite centre. In English football, this may have previously been called ‘the channel’, but that can be confused with the channel between individual players.
Although mainly used in tactical writing, their value as a descriptive term means they sometimes cross over into statistical writing too.
For a detailed article on why the halfspaces are useful tactically, read now-Red Bull Salzburg coach Rene Maric here.
Key entries
The number of times a team or player crosses the 18 yard line (if the 18 yard line was across the whole pitch).
Key pass
Also known as: Chance created, Shot assist
A pass (or miss-hit shot) that leads to a shot, including assists.
Non-penalty goals
Often abbreviated to: NPG
All goals that didn’t come as the direct result of a penalty (goals from rebounded penalties count).
Peak age
Studies on the age curve (here, for example) give an indication of a general age range where players are at their peak.
While not exact, most people use ages around 24-28 as the peak, but differ depending on position and, of course, each individual is different.
Possession adjusted
Often abbreviated to: PAdj
Often used with defensive statistics, these are metrics that have been adjusted to reflect the amount of possession a team has had.
Per 90 minutes
Often abbreviated to: per 90, p90, /90
An alternative to looking at ‘Total’ stats, ‘per 90 minutes’ refers to the number of actions per 90 minutes of playing time.
Usage is more widespread than alternative ‘per’ stats.
Per 100 possessions
Similar to per 90 minutes, this divides a player or team’s total stats to see what they do per 100 possession sequences of the ball that they have.
Per minute of possession
Similar to per 90 minutes, this is the number of ‘actions’ per minute a team has in possession. A good example of why this could be useful can be found here, by Jamie Kilday (@FitbaInScotland) on Modern Fitba.
Passes against Per Defensive Action
Often abbreviated to: PPDA
PPDA is a measure of describing how intense or effective a team’s high press is.
It is calculated by dividing the number of passes conceded by defensive actions. It often uses stats that occurred above a certain part of the pitch, like the opposition half, although methods do vary.
Possession sequences
Passages of play which belong to one team and are ended by defensive actions, stoppages in play or a shot (original definition from Opta).
Partly due to differences in data, different people count sequences of possession in different ways*, but the principal remains the same across them all.
*(they can even call them slightly different things!)
Pre-assist/Second assist
The pass before the assist (or the pass before the pass before the shot that turns into a goal).
Pressures
Also known as: Pressure actions
When a player moves towards an opponent on the ball to pressure them, but does not necessarily attempt a tackle.
Regressing to the mean
If statistics seem far away from a general average, they will likely move closer to it. Most often used when discussing the finishing of chances or a team’s results.
For example: “Oh, it looks like Cristiano Ronaldo’s started scoring again after that long goal-less spell, looks like he’s regressing to the mean and is finishing chances again.”
Or: “This team had lost 11 games in a row before getting a new man in charge and finally getting some points on the board. This new manager bounce is just regressing to the mean.”
Importantly, if a team/player has been finishing chances at a rate far above the general average, regressing to the mean doesn’t mean that they will start finishing at a rate far below the average.
Sample size
The size of the sample, whether that’s shots or matches or anything. It’s safer to draw conclusions from larger sample sizes; small sample sizes are potentially misleading.
Save percentage
The percentage of shots on target that a goalkeeper faces which they save.
Shots on target conversion (onTC%)
Also known as: on-target conversion rate. Often abbreviated to: onTC%
The rate of shots on target that are scored. It differs from conversion rate because that looks at all shots, while on-target conversion rate only accounts for shots on target.
Shots on target percentage (SoT%)
Also known as: on-target percentage. Often abbreviated to: SoT%
The percentage of all shots that a player or team gets on target.
Shot volume
An expression used to talk about how much a player is shooting, shorter than saying “X player is shooting more/less”.
For example: “Harry Kane’s shot volume has gone way down since his injury.”
Total shot ratio
Often abbreviated to: TSR
Similar to how we understand a team’s possession, this is the share of the shots that a team has. If the matches that a team plays in have 20 shots on average, and the team take 12 of those, their total shot ratio would be 60%.
The principle can equally apply to shots on target or expected goals, but the stat was more widely used in the earlier days of football analytics.
Tracking data
Also known as: positional data
Data that tracks where every player is on the pitch throughout a match, as well as the ball.
Offers an incredibly greater amount of information than event data but is also far more difficult to work with, and has far smaller availability.
Underlying numbers/statistics
A term used to refer to statistics like shots/expected goals, rather than looking at goals or results.
For example: “Fulham have started the season badly, with only a few points from their first eight games, but their underlying numbers are good so they should be fine in the long run.”
** Expected goals section **
Expected goals
Often abbreviated to: xG
A measure of chance quality, judging the number of goals a player or team would be expected to score from their shots.
Numerous factors (such as location and shot assist type) are used to calculate the expected goal value which, for individual shots, is a decimal between 0 and 1.
Expected goals assisted
Often abbreviated to: xA
A shot assist is given an expected goals assisted value if it sets up a shot. The expected goals assisted value of the pass is equal to the expected goals value of the shot it set up.
Post-shot expected goals
Most expected goals models were designed to judge the quality of chance that a team created. These models didn’t include where a shot ended up after it was kicked (a team shouldn’t be penalised for a striker fluffing a shot).
‘Post-shot’ expected goals models do take into account where the ball ends up (eg off target/middle of the goal/top corner).
These models can be particularly useful for looking at goalkeepers, as they should only be judged on the on-target shots they faced.
Non-shot expected goals
Also known as: ball progression models
‘Non-shot’ expected goals models recognise that sometimes a team can get the ball into dangerous positions without taking a shot.
They can be calculated on a basic level by saying ‘if a shot was taken from this position, what would its expected goals value be?’ but can be a lot more complex. The principle remains that teams or players can be rewarded for getting the ball into dangerous areas.
Expected passing
Often abbreviated to: xP. Also known as: Passer rating, passing ability
A model that judges the probability of completing each pass based on multiple factors, particularly pass start point and end point.
This can then be used to judge whether a player is better or worse at making passes than expected to.
xGChain
Every action in a possession sequence leading up to a shot is given the same xGChain value, namely the expected goal value of the shot. It can give credit to players who contribute in build-up play but who don’t take shots or directly set them up.
A player’s xGChain will involve the value of all of their shots, shot assists, and actions in build-up to shots.
xGBuildup
Similar to xGChain.
Every action in a possession sequence leading up to a shot is given the same xGBuildup value, namely the expected goal value of the shot. It can give credit to players who contribute in build-up play but who don’t take shots or directly set them up.
A player’s xGBuildup only involves the value of actions in build-up.
xGChain and xGBuildup were both metrics originating from Statsbomb, which have since been adopted elsewhere. Their introductory article on the two can be found here.
*
Created by Ashwin Raman and Mark Thompson. With thanks to Modern Fitba for use of their glossary as a starting point, and all other resources used.
